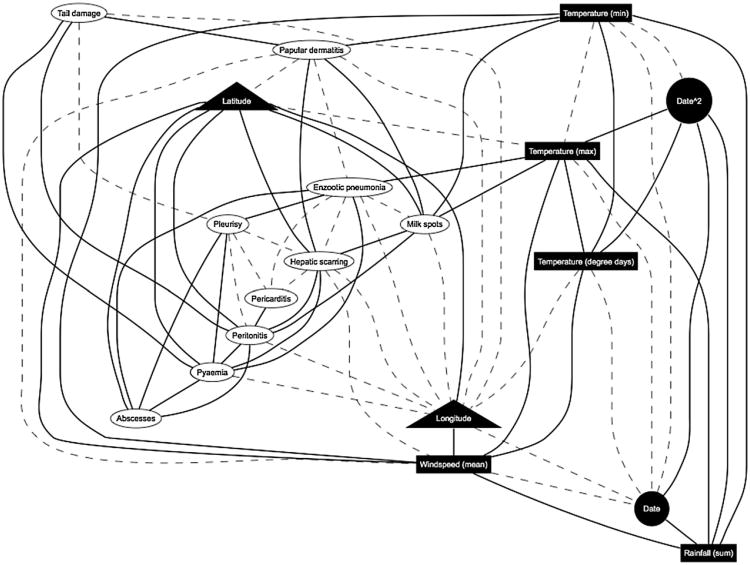
Fig. 1.
Most probable DAG (see Table 1 for variable names). Geographic variables, triangles; weather variables, rectangles; disease pathologies, ovals. Continuous nodes are shown in black, and binary variables in white. Dashed arcs are those lacking 50% support from bootstrapping, though present in the single best fitting DAG.

