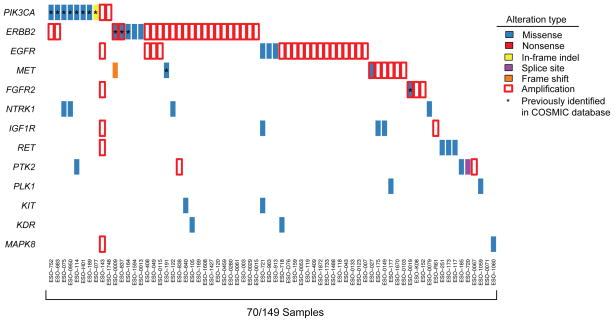
Figure 4. Somatic alterations in frequently altered pathways in cancer, putative therapeutic targets, and treatment biomarkers.
a) Potential therapeutic targets or treatment biomarkers are listed by sample. Each column denotes an individual tumor and each row represents a gene. Mutations are colored by the type of mutation event, and genes with amplification of greater than four copies relative to a diploid baseline are marked by red box.

