Figure 11.
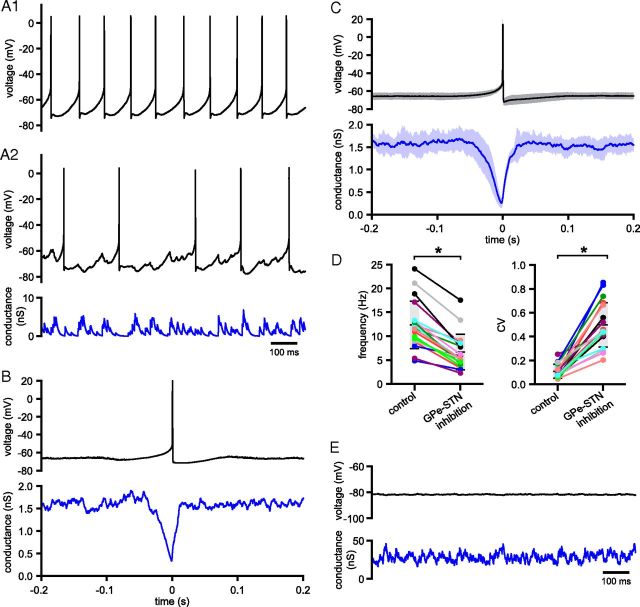
Tonic, irregular, asynchronous GPe–STN activity disrupts, but does not prevent, autonomous STN activity. Activity of a STN neuron (black) in the absence (A1) and presence of simulated GABAA receptor-mediated inhibition arising from 60 GPe–STN neurons discharging at 33 Hz in a nonsynchronous, irregular pattern (A2). The applied inhibitory conductance waveform is illustrated (blue). B, Spike-triggered average of action potentials (black) and the applied inhibitory conductance waveform (blue) from the example in A. C, Population data showing the mean ± SD (shaded area) spike-triggered average for all neurons tested. D, Population data illustrating the frequency and CV of firing in the absence and presence of simulated GPe–STN transmission. Data from individual STN neurons (colored lines and points) and the population means and SDs (horizontal black lines/gray boxes) are illustrated. E, Impact on the activity of a STN neuron (black) of simulated GPe–STN transmission arising from 60 GPe–STN neurons discharging at 33 Hz in a nonsynchronous, irregular pattern that was depressed in amplitude to the same level as in A2 but was 100% reliable (blue). *p < 0.05.

