
Figure 14.
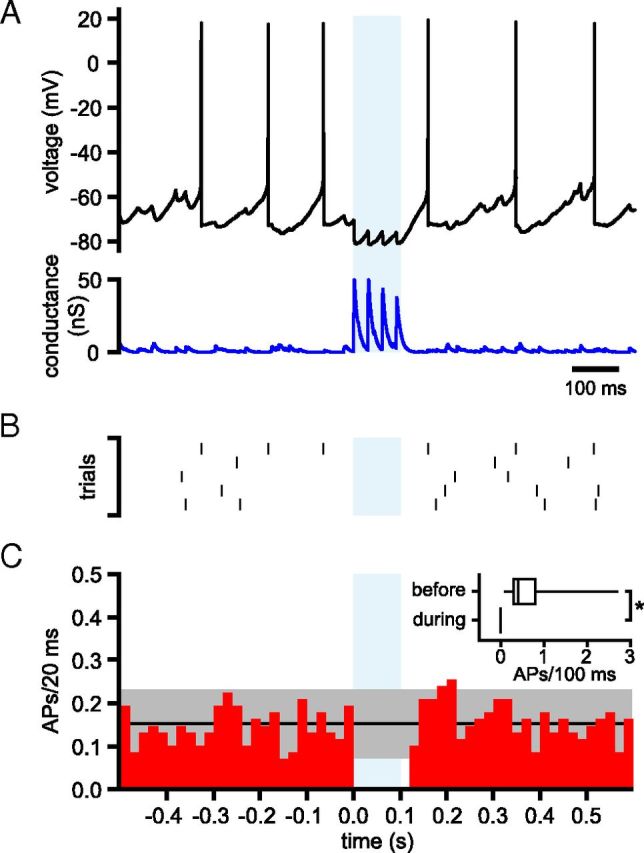
Effects of synchronized phasic 33 Hz firing of 10% of GPe–STN neurons on STN activity. A, Activity of a STN neuron (black) in the presence of simulated GABAA receptor-mediated inhibition (blue) arising from 54 GPe–STN neurons discharging at 33 Hz in a nonsynchronous, irregular pattern and from 6 GPe–STN neurons that discharged synchronously for 100 ms at 33 Hz but were otherwise inactive (light blue shaded area). B, Raster plot showing the times of action potentials in 5 trials from the STN neuron shown in A. C, Population PSTH showing action potentials (APs)/20 ms before, during, and after partial, phasic, synchronous GPe–STN activity. The black line and gray shaded area show the mean ± 2 SD of firing during nonsynchronous input. Inset, Box plots comparing action potentials 100 ms before and during 100 ms partial, phasic, synchronous GPe–STN activity/transmission. *p < 0.05.