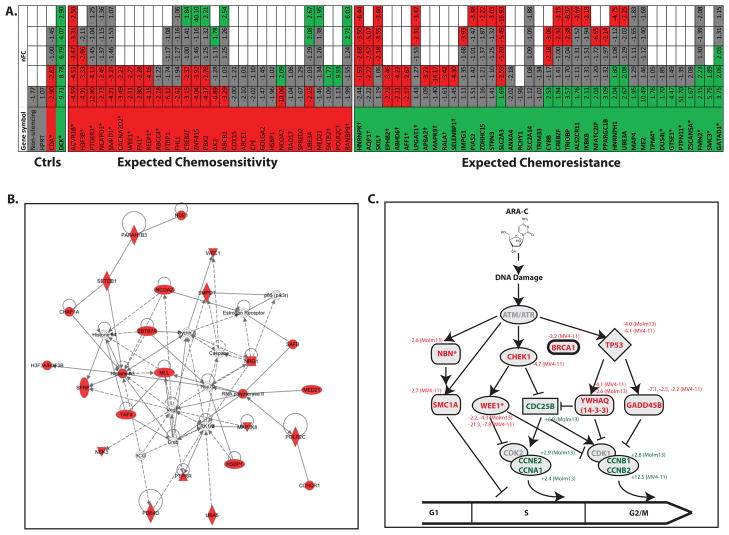
Figure 3. Cell cycle checkpoint proteins are critical mediators of AML cell fate after exposure to cytarabine.
A. High-throughput rescreening confirms the role of several mediators of chemosensitivity. Molm13 cells were transduced with an independent sub-library of shRNAs targeting a subset of 35 hits from the genome-wide screen, as well as negative control shRNAs targeting a non-coding sequence, the housekeeping gene HPRT, and functional controls CDA (which de-activates cytarabine) and DCK (which activates cytarabine). The cells were treated with cytarabine or left untreated and shRNA tags were isolated and quantified as before. Each targeted gene is represented by a column and each shRNA is represented by a row and color-coded for its representation in cytarabine: red (significantly under-represented), green (significantly over-represented) and gray (no change). Empty boxes reflect genes for which fewer than 5 shRNAs were included. The normalized Fold Change (nFC) of each shRNA in cytarabine is indicated within each box. Asterisks indicate genes considered validated. Daggers indicate genes for which shRNA representation was opposite of predicted. B. Pathways analysis of synthetic lethal hits from the genome wide screen identifies a cell cycle network as critical in determination of AML cell fate after exposure to cytarabine. The top scoring network in IPA among those proteins identified as chemosensitizing when inhibited is “Cell Cycle, Cellular Growth and Proliferation, Cancer.” C. Cell cycle checkpoint proteins implicated in the genome-wide screen. Review of data from the genome-wide functional genetic screen revealed several other genes involved in cell cycle checkpoints, for which there were at least one shRNA differentially represented in cytarabine treated cells, but which may not have reached threshold criteria to be included in the original list of hits. A schematic representation of their roles in cell cycle progression is presented with cell cycle inhibitors listed with red letters and cell cycle promoters listed with green letters. The normalized fold change in representation in cytarabine treated cells (and the cell line in which differential representation was noted) are listed next to the gene symbols. Asterisks indicate the genes that met criteria for inclusion in the overlapping list of hits from both analyses.

