Figure 3.

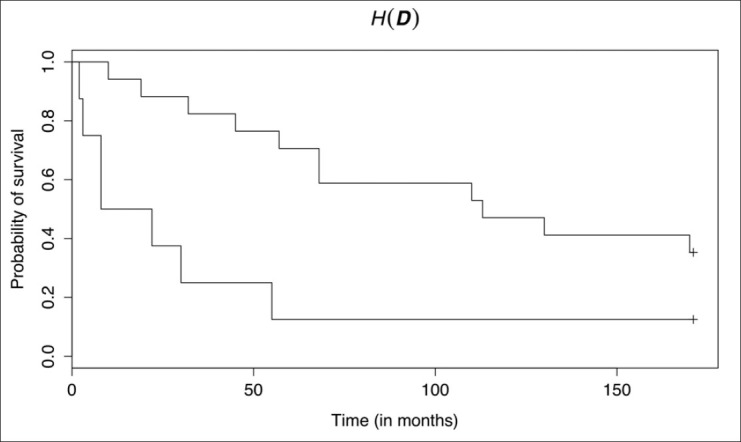
Survival curves—estimated using leave-one-out validation—for groups defined by thresholding H(D). The curves are statistically significantly different (P = 0.00750)

Survival curves—estimated using leave-one-out validation—for groups defined by thresholding H(D). The curves are statistically significantly different (P = 0.00750)