Figure 2.

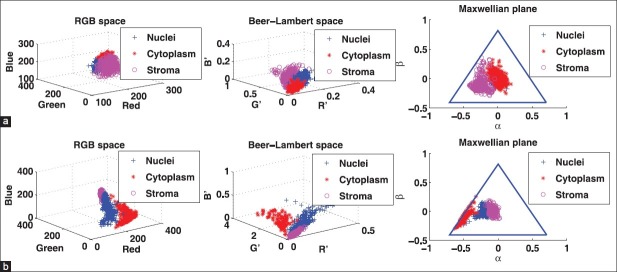
(a-b) Scatter plots in RGB space (left), Beer-Lambert space (center), and Maxwellian plane (right). (a) MILLERS -E. (b) CYTK

(a-b) Scatter plots in RGB space (left), Beer-Lambert space (center), and Maxwellian plane (right). (a) MILLERS -E. (b) CYTK