
Figure 4.
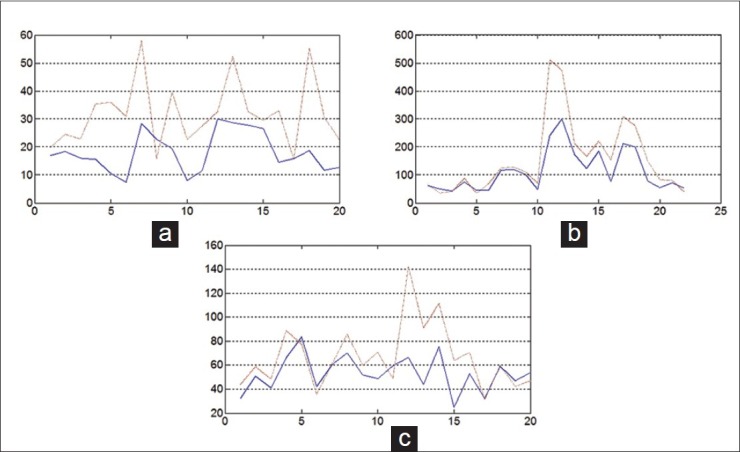
Boxplot of the alignment accuracy. x-axis indicates the annotations. y-axis is the Hausdorff distance (μm). The solid lines indicate the registration results with using content classification method. The dash lines indicate the results without using content classification method. (a) Colon specimen (H and E, Cytokeratin Immunohistochemical). (b) Vertebral specimen (Alcian Blue, EPSR). (c) Liver specimen (Reticulin, Masson trichrome)