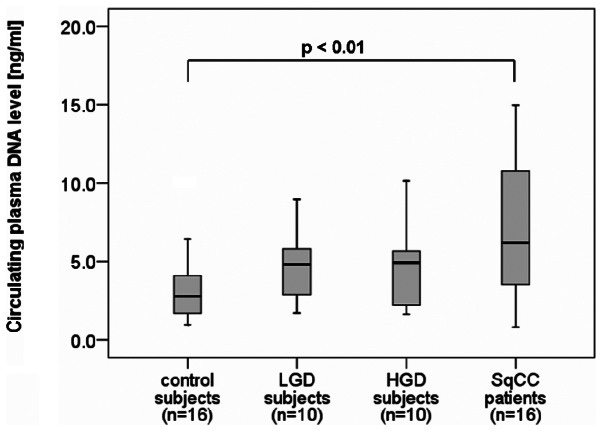
Figure 1.
Box plot displaying cpDNA levels among cancer-free control subjects (n=16), subjects with LGD (n=10), subjects with HGD (n=10) and patients with clinically overt SqCC (n=16). Black lines within the box represent median values, and the whiskers indicate the minimum and maximum values that lie within 1.5 × interquartile range. cpDNA, free-circulating plasma DNA; LGD, low-grade pre-invasive disease; HGD, high-grade preinvasive disease; SqCC, squamous cell carcinoma.

