Figure 4.

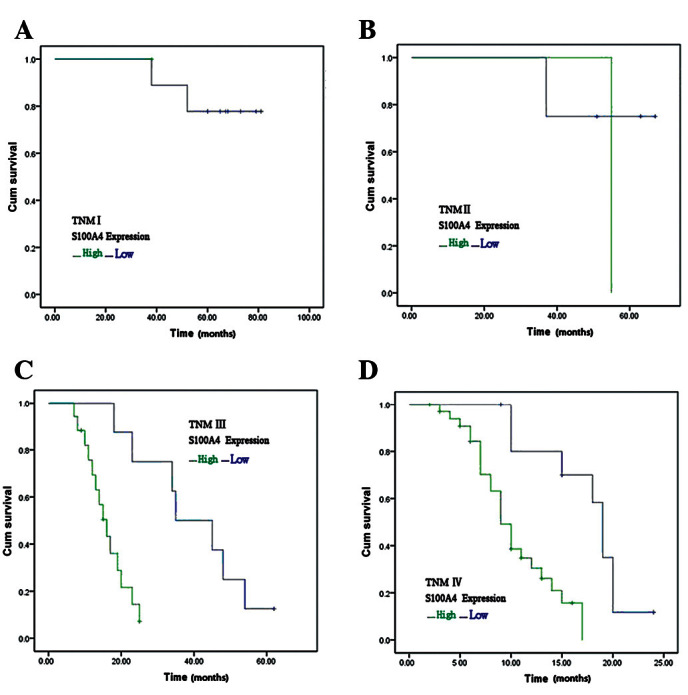
Kaplan-Meier curves with univariate analysis (log rank) for patients with low S100A4 expression vs. high S100A4 expression. (A) Stage I tumor. (B) Stage II tumor. (C) Stage III tumor. (D) Stage IV tumor. TNM, tumor-node-metastasis.

Kaplan-Meier curves with univariate analysis (log rank) for patients with low S100A4 expression vs. high S100A4 expression. (A) Stage I tumor. (B) Stage II tumor. (C) Stage III tumor. (D) Stage IV tumor. TNM, tumor-node-metastasis.