
Fig.2. DDC-fed mouse hearts have altered electrocardiographic, echocardiographic and hemodynamic parameters.
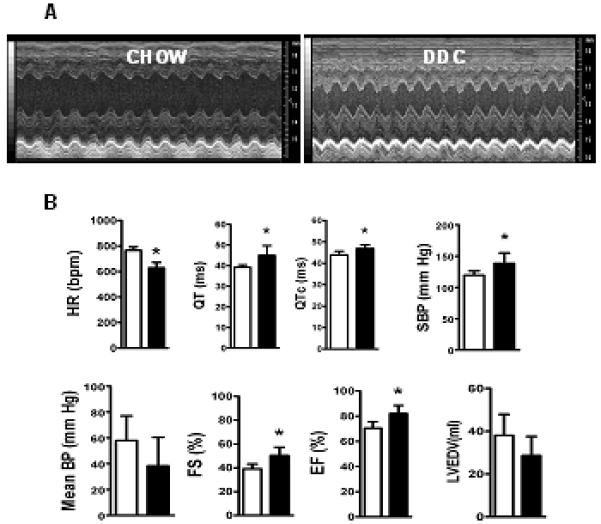
(A) denotes representative M-mode cardiac 2DEcho pictures of chow fed and DDC fed mice showing hyperdynamic LV in DDC fed mice. Bar graph in (B) denotes heart rate (HR), QT interval, corrected QT interval (QTc) as analyzed by rhythm strips, systolic (SBP) and mean (MBP) blood pressures as calculated in unsedated mice using tail-cuff, shortening fractions (%FS), ejection fractions (%EF) and calculated end diastolic volume (LVEDV) of the left ventricle by 2DEcho. (* p<0.05; n=6). Note: Chow (□) and DDC (■)