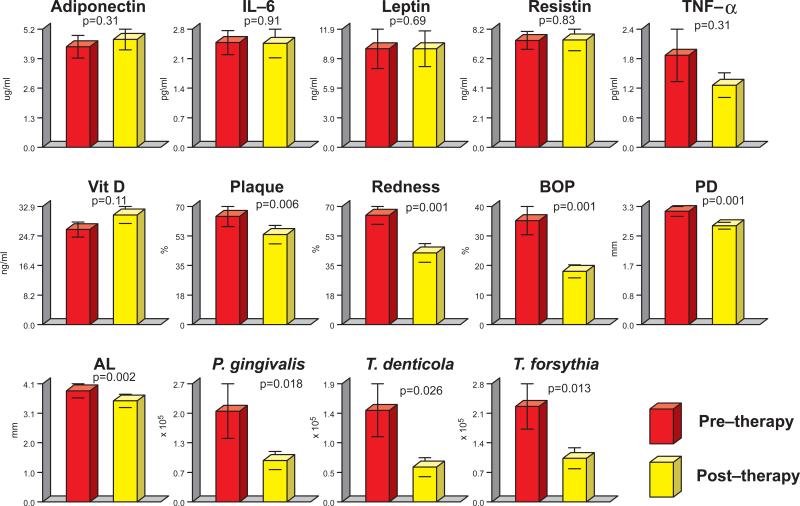
Figure 2.
Bar plots of mean serum analytes, mean periodontal clinical parameters and mean counts of red complex species (Porphyromonas gingivalis, Treponema denticola and Tannerella forsythia) (Socransky et al 1998)35 in subgingival plaque before (red bars) and after periodontal treatment (yellow bars). Due to the number of bacterial species evaluated, only those that presented difference in pre and post- treatment levels with an associated p value<0.05 were included in the figure. The bars represent values for each serum analyte, clinical parameter and bacterial species averaged within each subject and then averaged across subjects at each time point separately. The whiskers represent the standard error of the mean. Note that y axis values differ for each panel. Significance of differences between time points was sought using the Wilcoxon signed ranks test. Amounts of TNF-α were below the detection level in 1 of the subjects at baseline and was recorded as zero.

