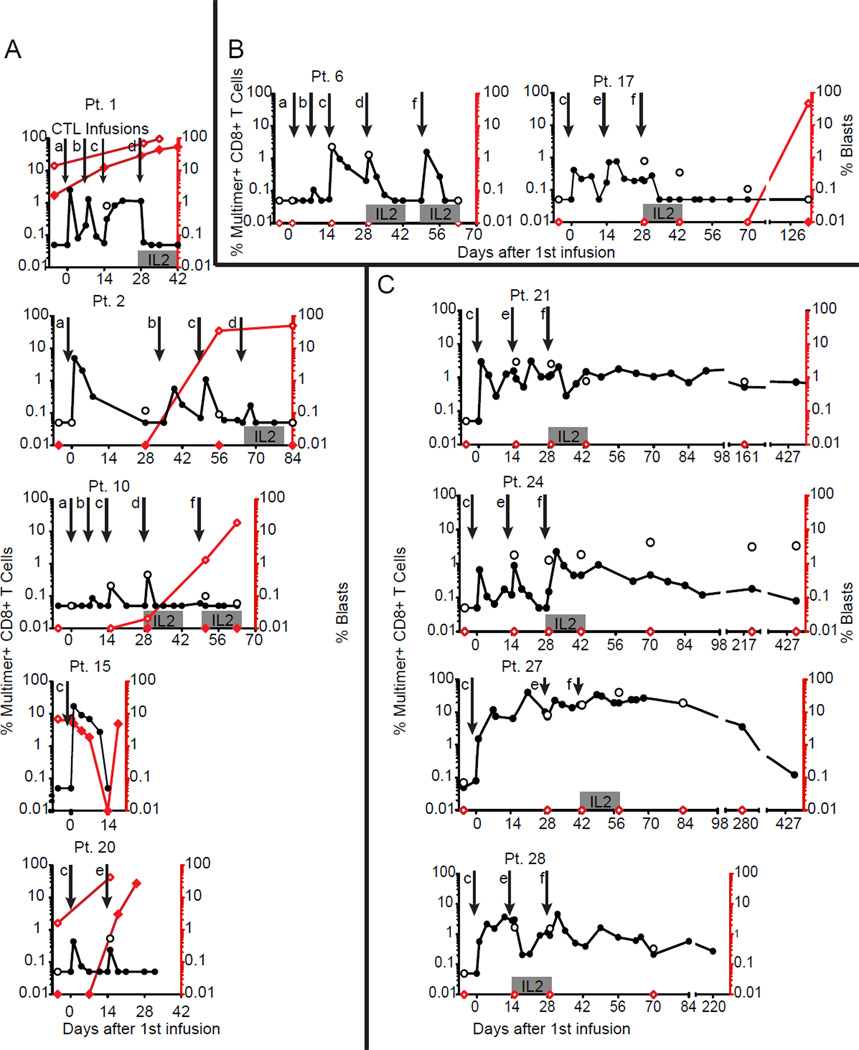
Figure 2. Kinetics of in vivo persistence of WT1-specific CTL clones and leukemia disease burden.
Percent multimer+CD8+ T-cells (left y-axis) in PBMCs (solid circles) and BM (open circles), and percent leukemic blasts (right y-axis) in PBMCs (solid red diamonds) and BM (open red diamonds) collected 7 days (+/−2 days) before and at defined timepoints after infusions are shown. (A) The 5 Pts who received clones generated without IL-21 with detectable leukemia at the time of treatment, (B) The 2 Pts who received clones generated without IL-21 without detectable leukemia at the time of treatment, and (C) the 4 patients who received clones generated in the presence of IL-21, including 1 with MRD (Pt 27) and 3 without detectable leukemia at the time of treatment. Infusion schedule indicated by downward arrows: (a) 3.3 × 10⁸ WT1-specific CTL/m2; (b) 1 × 10⁹ CTL/m2; (c) 3.3 × 10⁹ CTL/m2; (d) 3.3 × 10⁹ CTL/m2 followed by low dose s.c IL-2 × 14 days; (e) 1 × 10¹⁰ CTL/m2; (f) 1 × 10¹⁰ CTL/m2 followed by low dose s.c IL-2 × 14 days.

