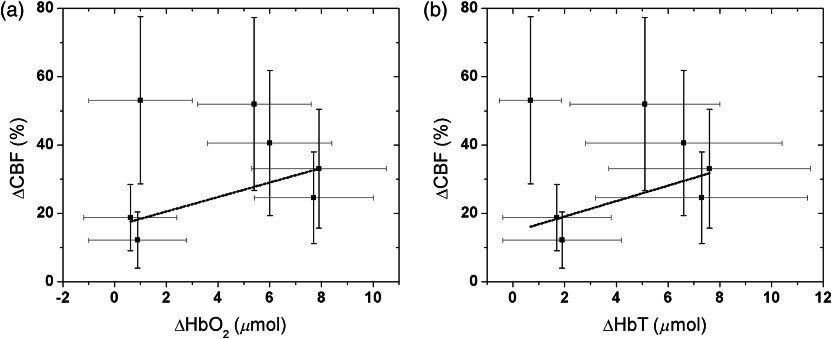
Fig. 3.
Correlation between changes in cerebral blood flow () and changes in (a) oxy-hemoglobin () and (b) total hemoglobin () concentration during on the ipsilateral side of stimulation. The lines correspond to the best linear fit considering the error bars and yielded values of 0.53 () and 0.47 ().

