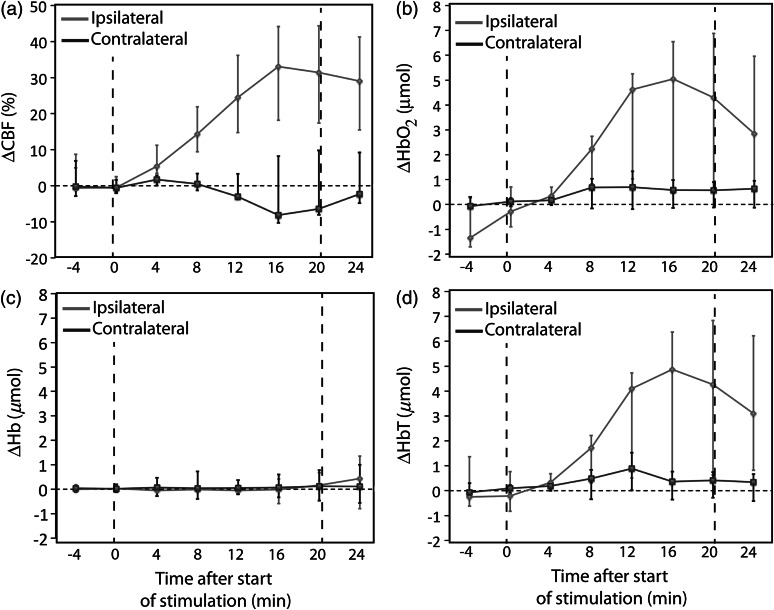
Fig. 4.
Temporal trends at every 4-min interval for measured changes in (a) cerebral blood flow (CBF), (b) oxy-hemoglobin concentration (), (c) deoxy-hemoglobin concentration (Hb), and (d) total hemoglobin concentration (HbT) before, during, and after administration. Each data point represents the median measurement across the whole population at each specific interval averaged 1-min epochs. Error bars are the interquartile range.

