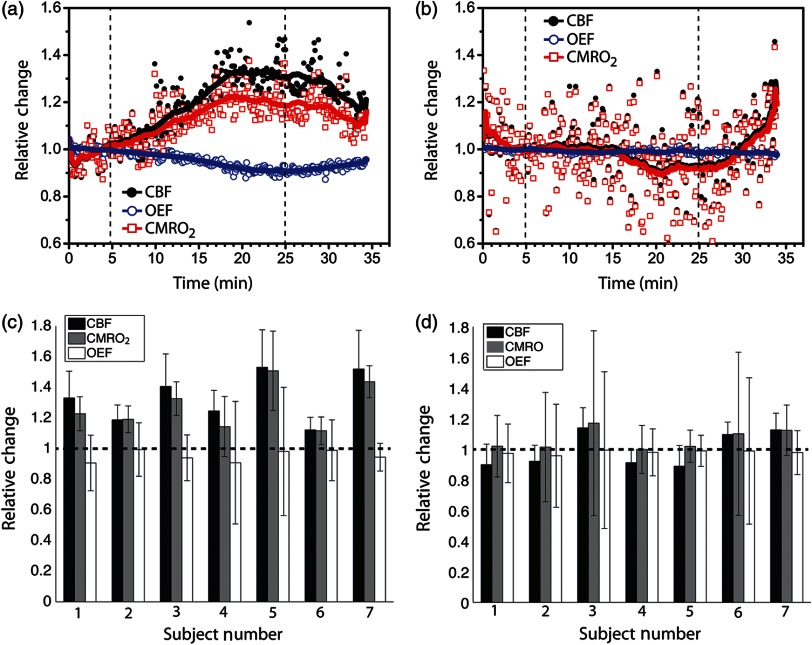
Fig. 5.
Relative cerebral blood flow (), oxygen extraction fraction (), and cerebral metabolic rate of oxygen consumption () in (a) ipsilateral and (b) contralateral hemispheres of administration for a single subject during the whole session. The vertical dashed lines indicate the beginning and the end of administration. The thick solid lines are the global trends. At the bottom row, we show the bar plots summarizing the maximum , , and changes for every subject in the (c) ipsilateral and (d) contralateral sides of stimulation.

