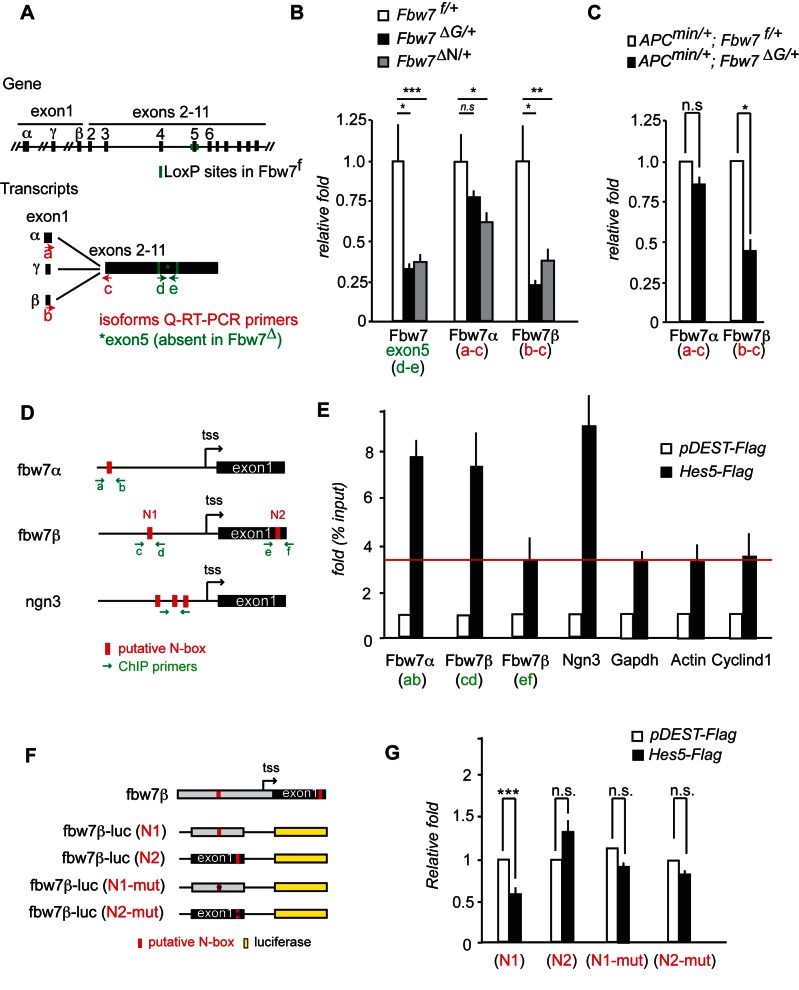
Figure 2. Fbw7β is transcriptionally regulated by Hes5.
(a) Schematic representation of the Fbw7 genomic locus (adapted from [24]). mRNA transcripts for the different Fbw7 isoforms and Q-PCR primers used to detect Fbw7 isoforms are depicted in the figure. (b) Q-PCR analysis of Fbw7α, Fbw7β, and Fbw7(exon5) in intestinal cells and NSCs isolated from Fbw7f/+ or Fbw7ΔG/+ mice and Fbw7f/+ or FbwΔN/+ NSCs, respectively (relative fold induction after normalizing to actin ± SEM, n≥3 for each genotype). (c) Q-PCR analysis of Fbw7α and Fbw7β in intestinal tumours isolated from APCmin/+; Fbw7f/+ or APCmin/+; Fbw7ΔG/+ mice (relative fold induction after normalizing to actin ± SEM, n≥3 for each genotype). (d) Schematic representation of Fbw7α, Fbw7β, and Ngn3 promoter regions. Red boxes denote consensus N-box sites. Green arrows indicate primers used for ChIP. (e) ChIP was performed using HCT116 cells transfected with p-Dest-flag or p-Dest-Hes5-flag. Flag binding to the consensus sites in Fbw7α, Fbw7β, and Ngn3 promoters was determined by Q-PCR. Data were represented as fold activation of percentage input versus the p-DEST-Flag samples. Red line denotes background-binding activity. (f) Schematic representation of the different Fbw7β-luciferase constructs generated. Red rectangles represent putative N-boxes. Crossed red rectangles represent mutated N-boxes. (g) HCT116 cells were transfected with Fbw7β–N1, Fbw7β–N2, Fbw7β–N1-mut, pGL3–Fbw7β–N2-mut together with p-Dest-Hes5-Flag overexpression vector or p-Dest-flag as a control. Data represent luciferase activity relative to Fbw7β–N1+pDest-flag transfected cells.

