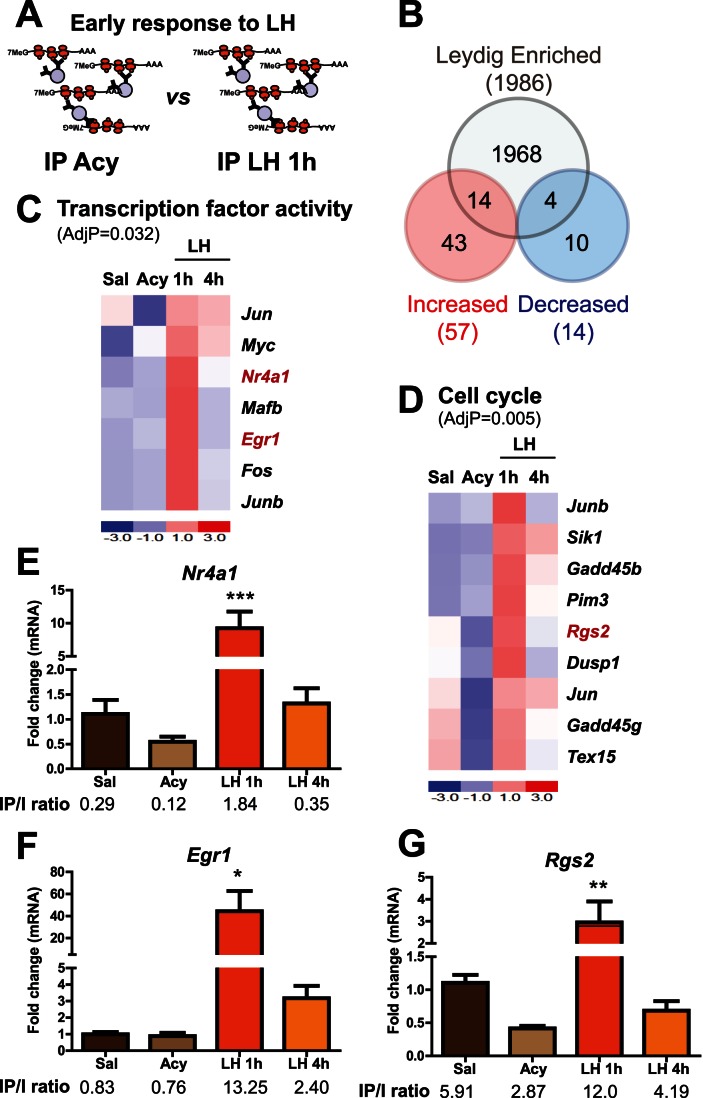
Figure 4. In vivo Leydig cell translational profile after 1 h of LH administration.
(A) Cartoon shows the two experimental groups compared by microarray analysis. (B) Venn diagrams showing the number of mRNAs regulated after 1 h of LH administration (1.5 fold or higher) when compared to the acyline group in the IPs of Cyp17iCre: RiboTag mice by microarray analysis. Values in the intersection are the number of transcripts regulated by LH and enriched (IP/input >2 in untreated mice) in Leydig cells. GO analysis was performed on the transcripts that showed a fold increase of 1.5 or higher after 1 h of LH stimulation. Transcription factor activity (C) and cell cycle (D) were identified as significant categories. Heat maps show the regulation by microarray analysis of the transcripts included in these GO categories. AdjP: Adjusted p-value. Some transcripts (shown in red) were further confirmed by qRT-PCR because of their novelty or significance (E–F and G). Graphs show qRT-PCR confirmation for Nr4a1, Egr1 (E–F) and Rgs2 (G) in the IPs of Cyp17iCre: RiboTag mice treated with saline, acyline, acyline+LH for 1 h and acyline+LH for 4 h (n = 4, from two independent experiments). Statistical analysis was performed using One-way Analysis of Variance (ANOVA) with Newman-Keuls multiple comparison post-hoc test. *** p<0.001, ** p<0.01 and * p<0.05 vs acyline. IP versus input ratio (Enrichment) was assessed by qRT-PCR and shows the abundance of the transcript in Leydig cells. Data are the mean±SEM.

