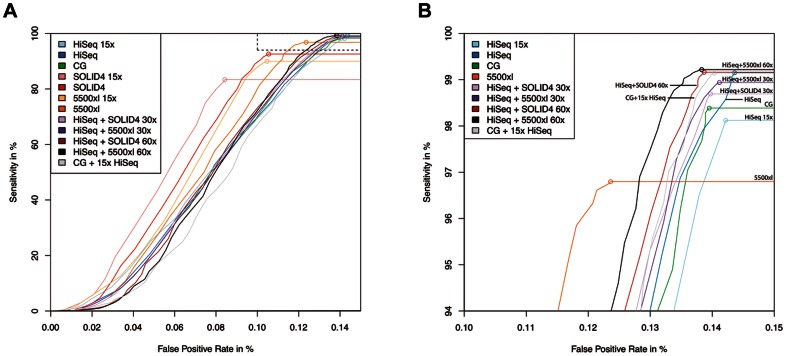
Figure 5. Receiver operating characteristic curves comparing sensitivity and specificity of all sequencing platforms for SNV calling.
All curves are computed for exemplary patient sample MB24. When no additional coverage information is indicated, the curves are computed on full coverage data (for coverage information see Table 1). Additional numbers indicate either computationally downsampled data or combined data at specified additive coverage. (a) Specificity plotted from 0–0.15. All curves have reached their plateau at that point and will continue as straight lines. (b) Magnified view of curves as indicated by dashed frame in a) to discriminate between subtle differences in specificity and sensitivity for all curves. Curves that do not appear in this magnified view reached their plateau below the cutoff of 94% sensitivity chosen for this window.

