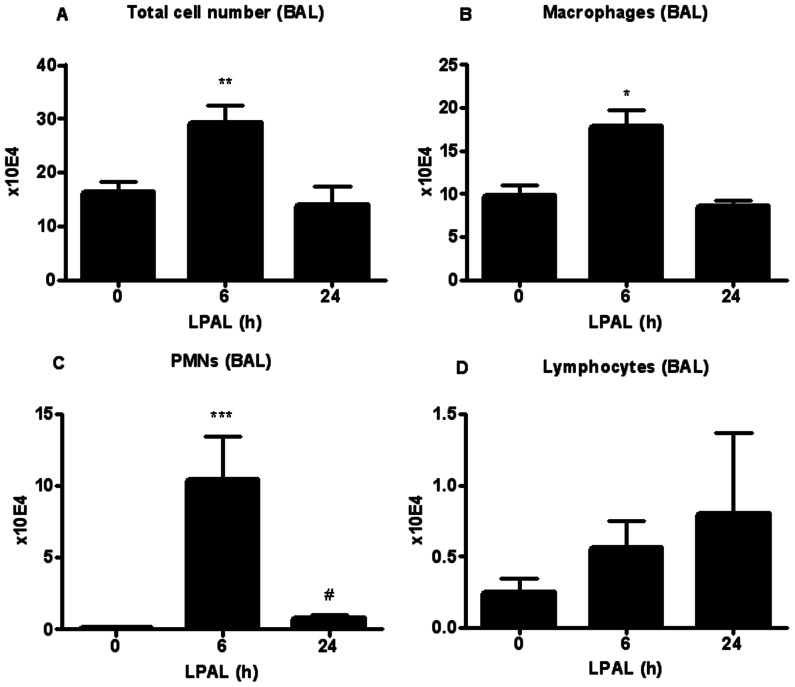
Figure 3. Inflammatory cell profile in BAL during the initial 24 h after LPAL.
The total cell number (A) significantly increased at 6 h LPAL (10 rats/group, *P<0.05) then decreased at 24 h LPAL (3 rats/group), returning to baseline (0 h LPAL). The number of macrophages (B) (3–8 rats/group, *P<0.05), as well as the number of neutrophils/PMNs (6–11 rats/group, ***P<0.0001) followed the same trend. Lymphocytes (D) did not change during the same time course (3–7 rats/group). P measured vs 0 h LPAL.

