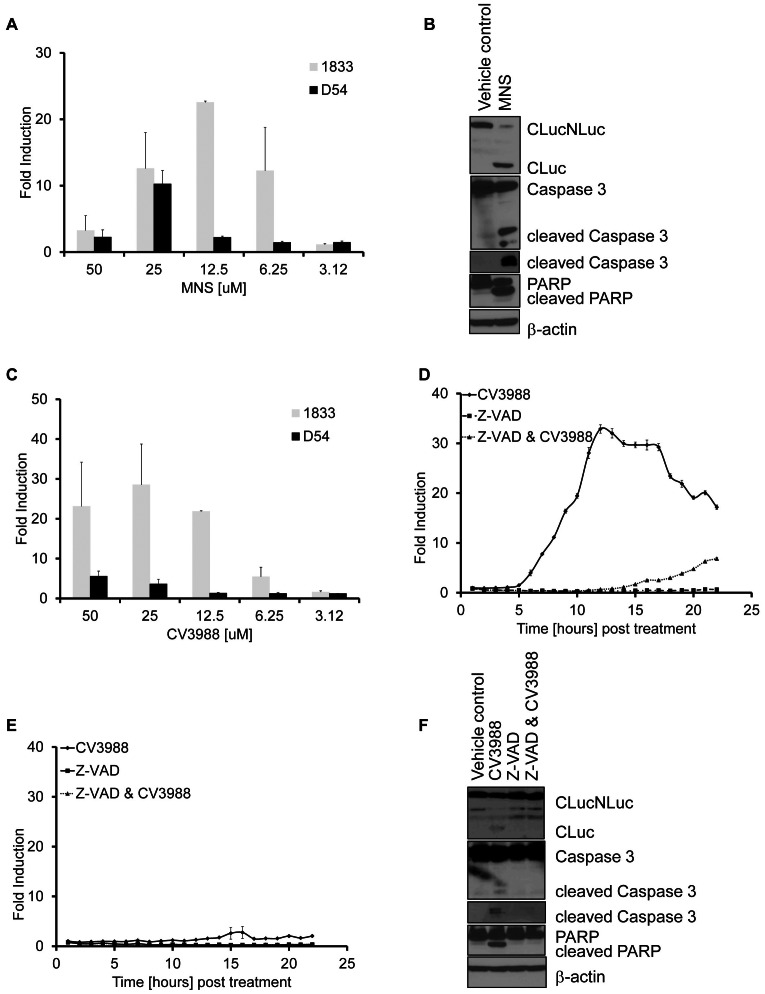
Figure 5. Validation of HTS hits.
A) Bioluminescence activity of cells treated with MNS was measured at 12 hours post treatment and plotted as fold induction. Experiments were performed at least in triplicates (mean ± SEM). B) Representative western blots for Luciferase, cleaved Caspase 3 and PARP or β-Actin as loading control of D54 cells treated with (25 µM) MNS for 12 hrs. C) Bioluminescence activity of cells treated with increasing concentrations of CV3988 at 12 hours post treatment. Data are plotted as fold induction over values obtained from vehicle treated cells. Experiments were performed in triplicates (mean ± SEM). D and E). Bioluminescence activity was measured at various time points using 1833 (D) or D54 (E) cells treated with CV3988 (12.5 µM), Z-VAD (20 µM) or a combination of Z-VAD plus CV3988 for 24 hrs. Data are plotted as fold induction and experiments were performed in triplicates and plotted as mean ± SEM. F) Representative western blots of Luciferase, Caspase 3, PARP or β-actin were performed on lysates obtained from D54 cells. Cells were either treated with CV3988 (12.5 µM), pre-treated with Z-VAD (20 µM) or treated with Z-VAD and CV3988 for 12 hrs.

