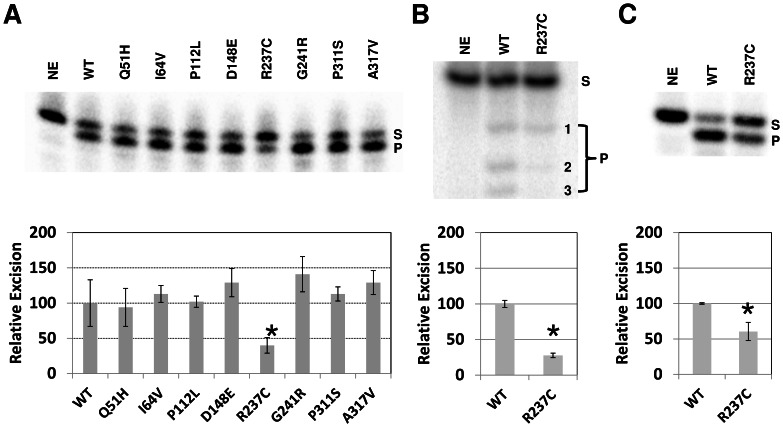
Figure 4. Exonuclease and 3′-repair assay.
(A) Wild-type (WT) and variant APE1 proteins (250 ng) were incubated with 32P-labeled partially duplex 15P/34G DNA substrate (0.5 pmol), and the reactions were resolved on a high resolution denaturing sequencing gel (top). Substrate (S) and exonuclease degraded product (P) were visualized and quantified using standard phosphorimaging analysis. NE = no enzyme. Graph of relative 3′ to 5′ exonuclease efficiency is shown (bottom), depicting the average and standard deviations of 4 independent experiments. *, p = 0.01. (B) Partial duplex 17P/34G substrate (0.5 pmol) was incubated with APE1 proteins (250 ng) and products were resolved on a high resolution denaturing sequencing gel. Products were detected using phosphorimaging analysis. Densitometry results are graphed below from 3 independent assays. *, p = 0.0009. (C) The 3′-phosphate partial duplex 15-p/34G DNA substrate (0.5 pmol) was incubated with APE1 proteins (1 ng) and products were resolved on a high resolution denaturing sequencing gel. Densitometry results are graphed below from 3 independent assays. *, p = 0.01.

