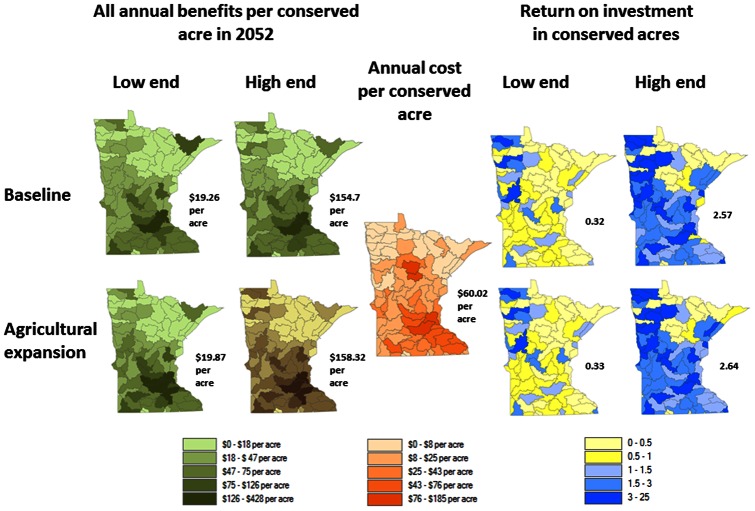
Figure 6. The range in benefits per acre (2010$) for all the ecosystem services (species scores not included), the annualized costs per acre, and the range in return on investment from the post-1988 public acquisitions under the baseline and agricultural expansion scenarios.
The numbers by the side of each map indicate the state average.

