
Figure 8. Natural log of the post-1988 publically acquired acres for each 8-digit watershed as explained by the annual (a) cost per acre, and the baseline LULC (b) benefits per acre in 2052 (in 2010 $) and (c) return on investment.
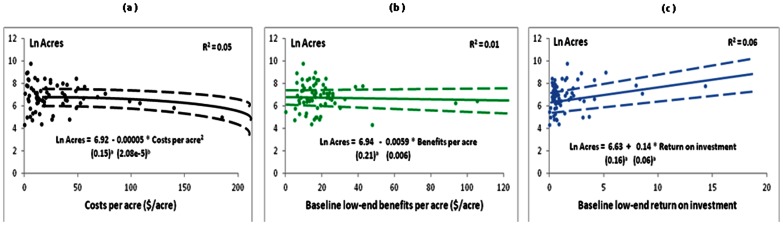
Here we use the low-end of service values. Solid line represents the best fitting model, dashed lines represent ±1 standard error (SE). Robust standard errors shown in parentheses. a indicates indicates significance at the 10% level. The best fit in panel (a) based on the residual sum of squares criterion is a non-linear quadratic.