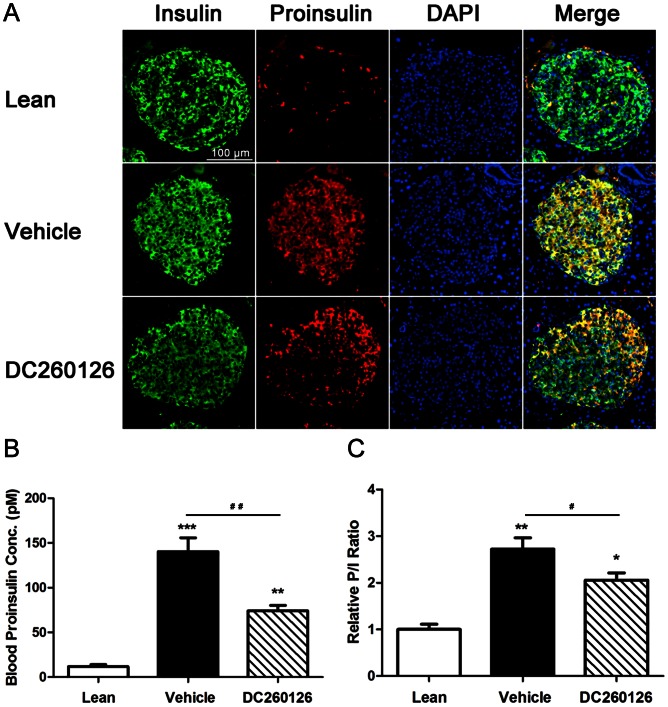
Figure 4. The expression of insulin/proinsulin and P/I ratio analysis in db/db mice.
(A) Double immunofluorescence of insulin (green fluorescence) and proinsulin (red fluorescence) from pancreas in different groups, the merged figures were shown in right. The scale bar = 100 µm, and referred to all panels. (B) The blood proinsulin concentrations were measured by ELISA kit, and proinsulin-to-insulin ratio were shown in the graph (C). All data are mean ± SE and * indicated significant differences (*p<0.05, ** p<0.01, *** p<0.001 compared to lean group, # p<0.05, ## p<0.01 showed the significant differences between vehicle and DC260126-treated group).

