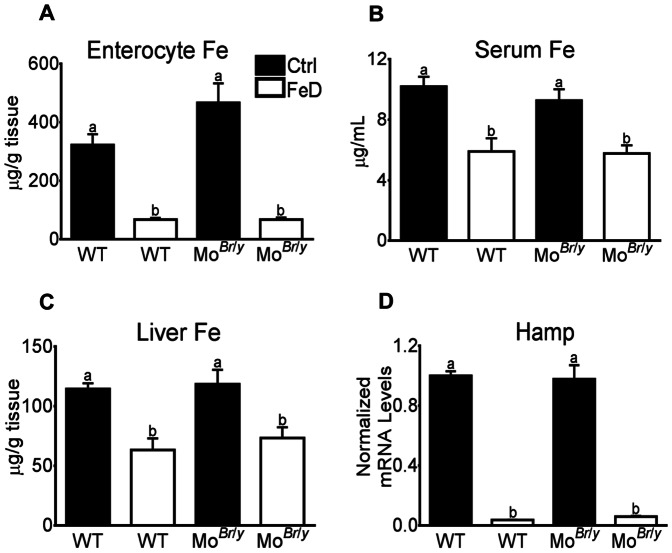
Figure 2. Tissue Fe levels and hepatic hepcidin (Hamp) gene expression.
Iron levels were determined as described in Methods. Results are depicted graphically, with filled bars representing data from mice fed the control diet and open bars depicting data from FeD mice. Genotype is indicated beneath each bar. Iron levels were normalized by mass of tissue or volume of serum. (A) Enterocyte Fe content, n = 3 per group; (B) Serum Fe content, n = 4 for WT mice and 3 for MoBr /y mice; (C) Liver Fe content, n = 10 mice per group. Also depicted is hepatic Hamp mRNA expression (D), normalized to cyclophilin mRNA levels (which did not vary significantly). n = 8 per group. a,b Statistically different from one another within each panel (p<0.05). WT, wild-type. Bars (A–D) depict mean±SD.

