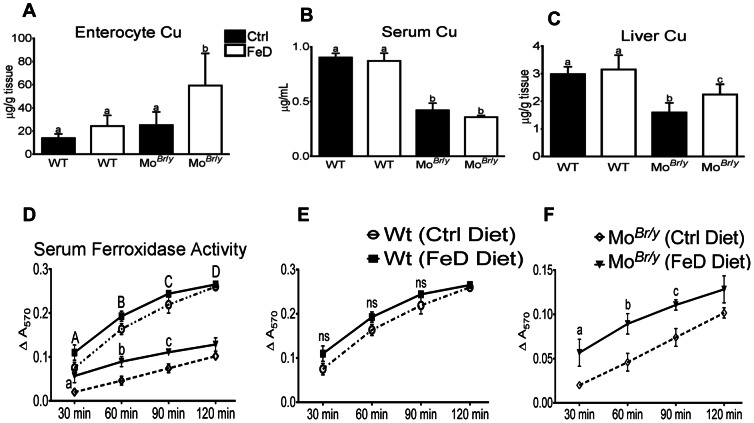
Figure 5. Tissue and serum Cu levels and serum FOX activity in experimental mice.
Copper levels were determined as described in Methods (A–C). Results are depicted graphically, with filled bars representing data from mice fed the control diet and open bars depicting data from FeD mice. Genotype is indicated beneath each bar. Copper levels were normalized by mass of tissue or volume of serum. (A) Serum copper levels, n = 4 for both groups of WT mice and n = 3 for both groups of MoBr /y mice; (B) Enterocyte copper levels, n = 3 for all groups; (C) Liver Cu levels, n = 10 for all groups. a,b Statistically different from one another within each panel (p<0.05). Also depicted is quantification of serum FOX activity (D–F), as determined by ferrozine assay. Composite data from all 4 groups is shown in panel D, while panel E shows data from WT mice consuming control or low-iron diets and (F) depicts data from MoBr /y mice on both diets. (D) Uppercase letters indicate that data from both control groups statistically differ from data from both groups of MoBr/y mice, while lowercase letters indicate significance between the MoBr /y mice on the different diets (p<0.05 for both); (E) ns, not-significant; (F) Lowercase letters indicate significance between groups at individual time points (p<0.05). (D–F) Statistics by 2-way ANOVA followed Bonferroni’s multiple comparisons test. n = 4 for both control groups and n = 3 for both groups of MoBr /y mice. Bars (A–F) depict mean±SD.

