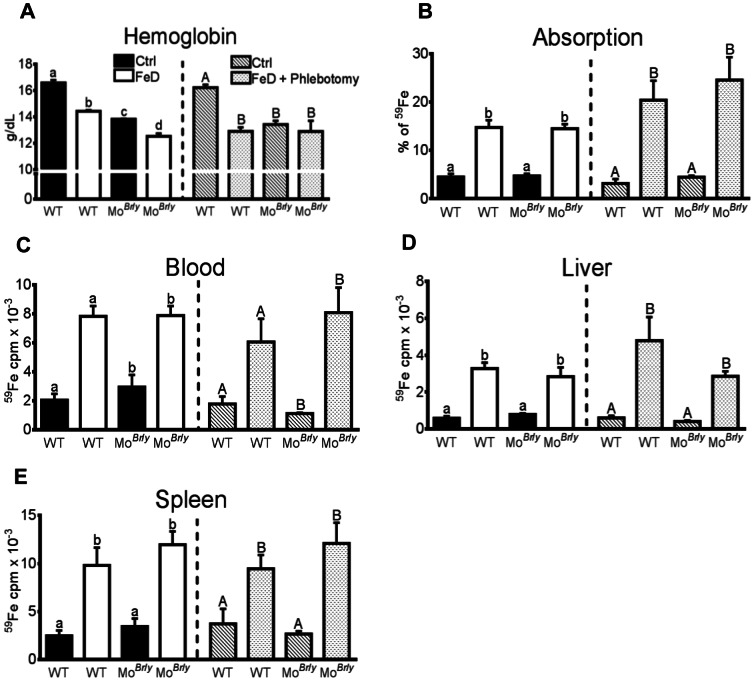
Figure 6. Intestinal iron absorption and whole-body iron utilization in experimental mice deprived of dietary iron with or without concurrent phlebotomy.
Mice were fed a control diet or an iron-deficient diet for three weeks with or without concurrent once weekly bloodletting. Subsequently, 59Fe was administered by oral gavage and the distribution of radioactivity was assessed 24 hours later. Blood hemoglobin levels are depicted (A) as well as % of 59Fe dose absorbed (B), as an indicator of intestinal iron absorption, and radioactive counts in blood, liver and spleen (C–E). In all panels, the left side depicts data from dietary iron deprivation only, while the right panel shows data from dietary iron deprivation plus bleeding. Each bar is defined in panel A, and is consistent throughout all panels. a, b and A, B indicate statistical significance between groups within each one half of an individual panel (p<0.05). Genotypes are indicated below each bar. For dietary treatment groups, n = 3 for all; for dietary treatment plus phlebotomy groups, n = 5 for WT mice fed the control diet, n = 6 for WT mice consuming the low-iron diet, and n = 4 for MoBr /y mice consuming both diets. Bars (A–E) depict mean±SD.

