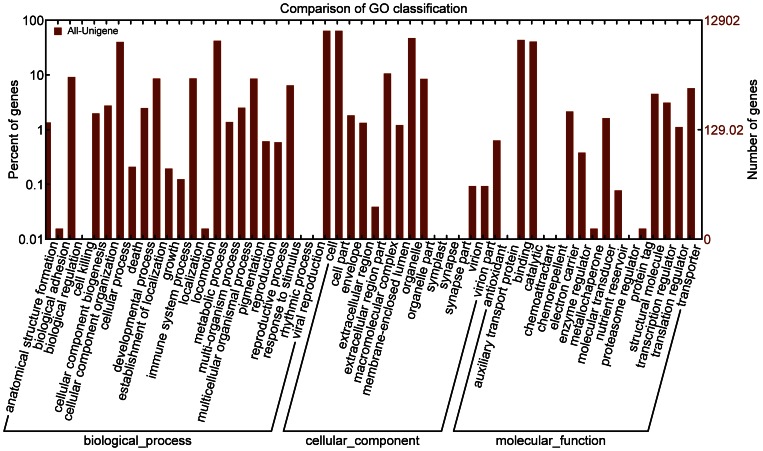
Figure 2. GO categories of the P. pruinosa all-unigenes.
WEGO was used to produce the graph. The results are summarized in ‘biological process’, ‘cellular component’, and ‘molecular function’. The percentage (left y-axis) and total number (right y-axis) of all-unigenes in each category (the third GO level) are shown. In total, 11 587 all-unigenes have been assigned. Y axis is in log(10) scale.

