
Figure 1. Gating strategy.
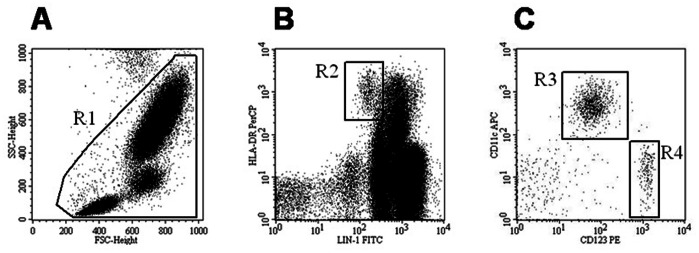
Representative immunophenotype plots of the whole blood sample from one HC subject are reported to show the gating strategy. Total cells were identified in a forward scatter (FSC)/side scatter (SSC) plot and gated (R1, left panel A). Then DC were identified by gating lineage negative (Lin−) cells (R2, middle panel B). Finally, myeloid DC (R3) were identified by CD11c and HLA-DR expression, while plasmacytoid DC (R4) were identified by CD123 and HLA-DR expression (right panel C).