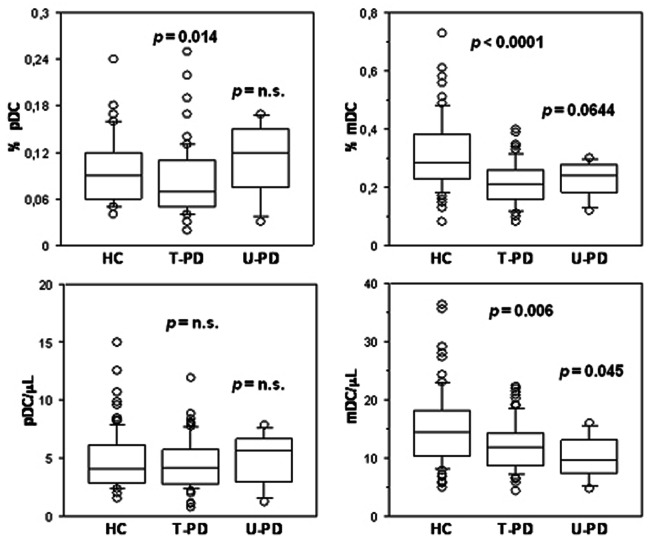
Figure 3. Blood DC decline in PD subgroups.
The distribution of percentage values (upper panels) and total counts (lower panels) of pDC (left panels) and mDC (right panels) present in blood of HC (n = 80), dopaminergic drug-treated PD (T-PD, n = 73) and drug naïve PD (U-PD, n = 7) subjects is reported in the respective box-and-whisker plot, as indicated.

