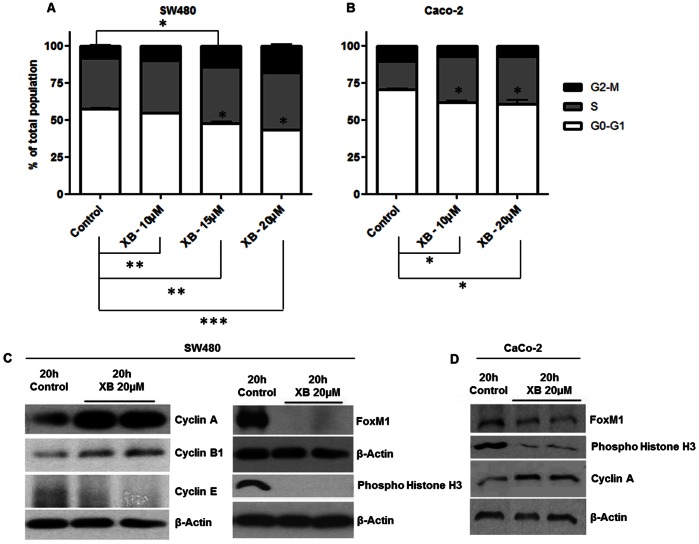
Figure 3. XB-induced cell-cycle blockade.
Semi-confluent cultures of SW480 (A) and Caco2 (B) cells were exposed to the indicated concentrations of XB. 48 hours later nuclei were isolated for the analysis of cell cycle distribution by FACS analysis. The results shown are the mean±SD pooled from three independent experiments. Protein lysates were harvested 20 hours after exposure of SW480 (C) and Caco2 (D) cells to 20 µM XB and levels of Cyclins A, B1, and E as well as of FoxM1 and phospho-Histone H3 were analysed by western blotting. The figure shows representative examples of two independent experiments.

