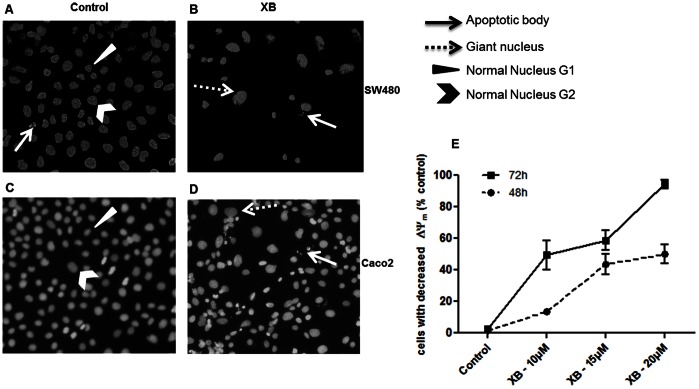
Figure 4. XB-induced active cell death.
A, B, C, D: In a parallel experiment cultures were fixed after 48 hours of XB-exposure and stained with Hoechst 33258 for visualisation of nuclear morphology (A: control SW480, B: XB treated SW480, C: control CaCo2, D: XB treated CaCo2). E: Semi-confluent cultures of SW480 were exposed to the indicated concentrations of XB and harvested 48 and 72 hours later for determination of mitochondrial membrane potential (MMP). The results shown are the mean±SD pooled from three independent experiments.

