
Figure 2. Reductions in GM volumes in stressed subjects.
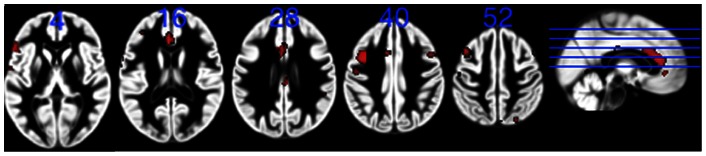
Significant reductions in the GM (red) in stressed subjects compared with controls. Clusters calculated using peak threshold at p = 0.001, FDR corrected at p<0.05. All the clusters are superimposed on the GM template from the entire study group. The numbers indicate z-levels in MNI co-ordinates. R = right side.