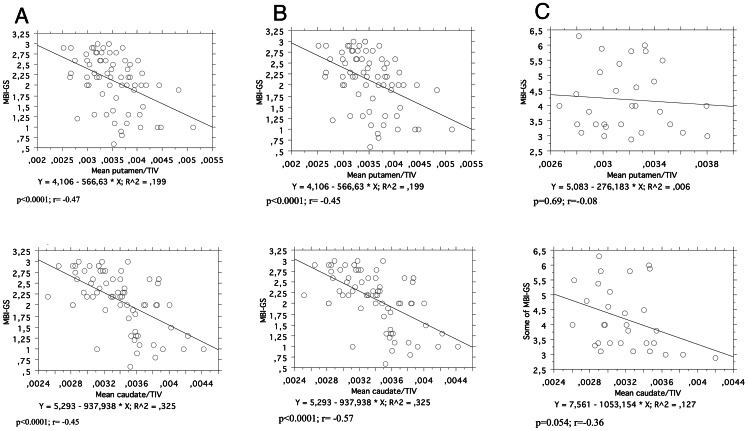
Figure 3. Correlation analysis between stress scores (MBI-GS) and the relative putamen volume (mean of the right and left putamen/TIV) – upper panel, and the relative volume of the caudate (mean of the right and left caudate/TIV) – lower panel.
A = All subjects; B = Control subjets only; C = Stressed subjects only.

