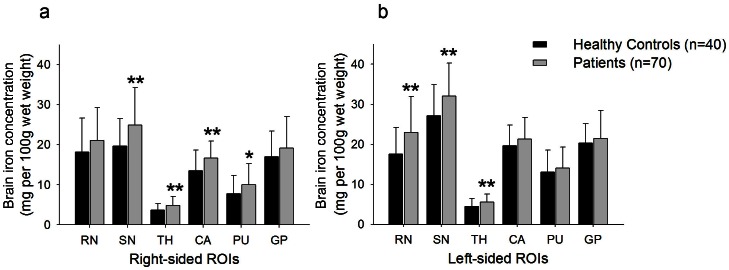
Figure 2. Comparison of brain iron concentration between healthy controls and cirrhosis patients.
Bar plots of the average iron concentration with standard deviations for each ROIs of (a) the right and (b) the left hemisphere in healthy controls and patients with cirrhosis. *P<0.05; **P<0.01 (difference of phase value in comparison to healthy control group was evaluated with an independent-sample t test) RN, red nucleus; SN, substantia nigra; TH, thalamus; CA, caudate; PU, putamen; GP, globus pallidus; ROI, region of interest.

