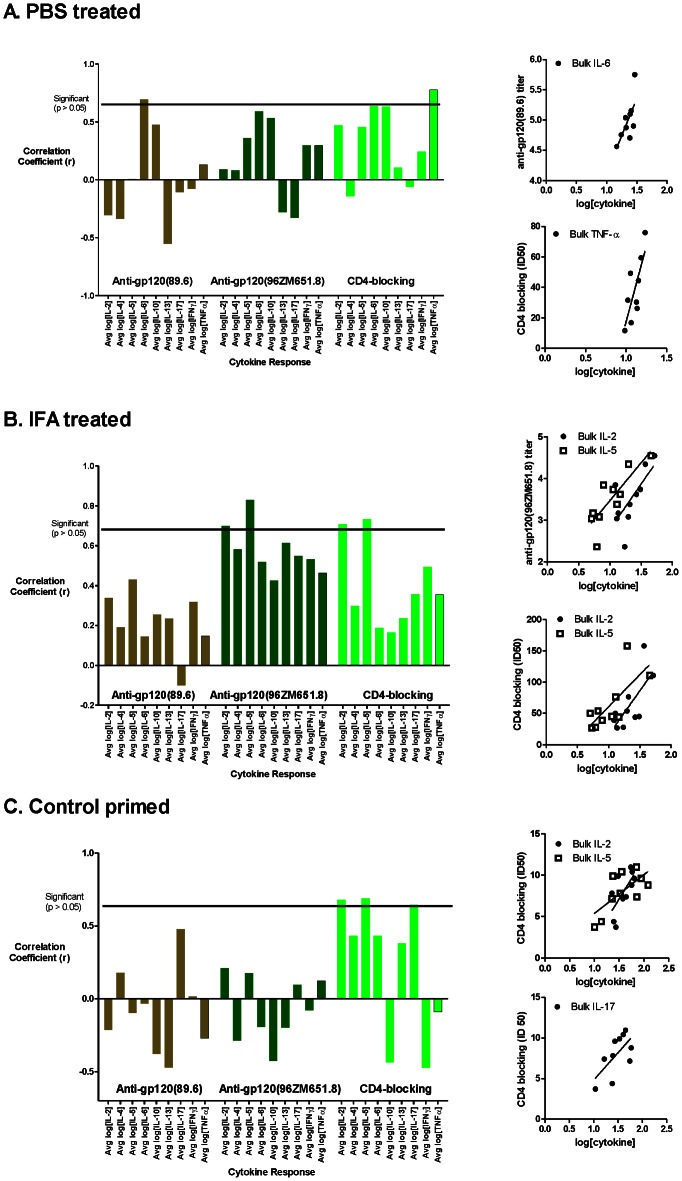
Figure 2. Correlation of antibody and bulk T-cell responses in the unprimed (A, B) and control-primed (C) mouse groups.
Bar graphs indicate Pearson correlation coefficients for the bulk cytokine response with reactivity to the indicated antigens. Scatter plots illustrate the significant correlations (p<0.05). Bulk IL-6 and TNF-α correlated with gp120 and CD4-blocking antibodies, respectively, in the PBS-treated mouse group (A). Bulk IL-2 and IL-5 correlated with gp12096ZM651.8-crossreactive and CD4-blocking antibodies in the IFA-treated mouse group (B). Bulk IL-2, IL-5, and IL-17 correlated with CD4-blocking antibodies in the control-primed group (C).

