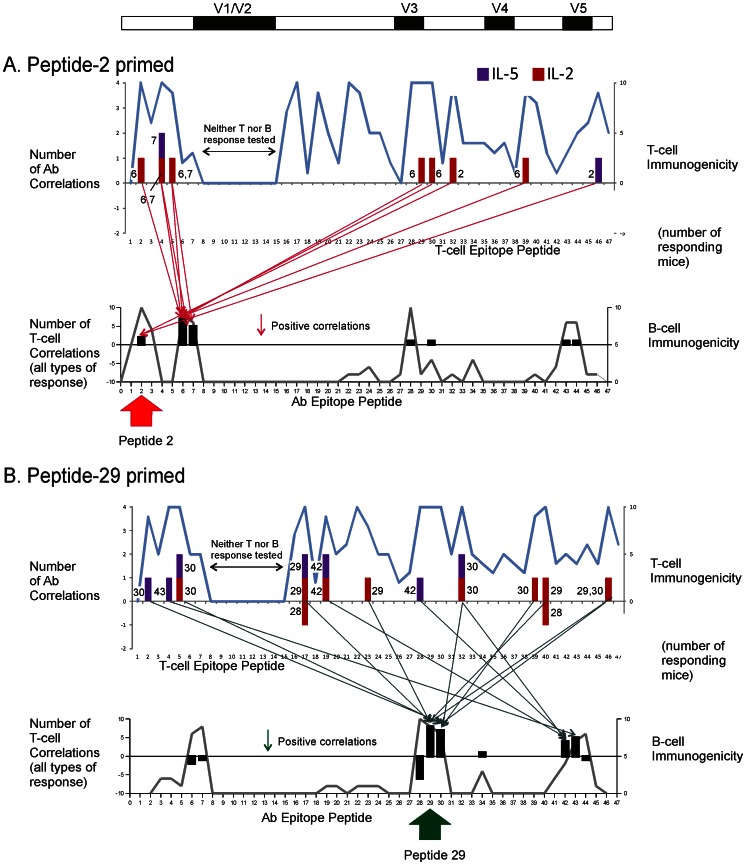
Figure 4. Epitope-specific T-B correlations in mouse groups primed with gp120 peptide 2 (A) and peptide 29 (B).
The notation is as described in the legend for Fig. 3. The priming peptide is indicated below the graph of B-cell specificity. T-B correlations were concentrated on B-cell specificities near the priming peptide.

