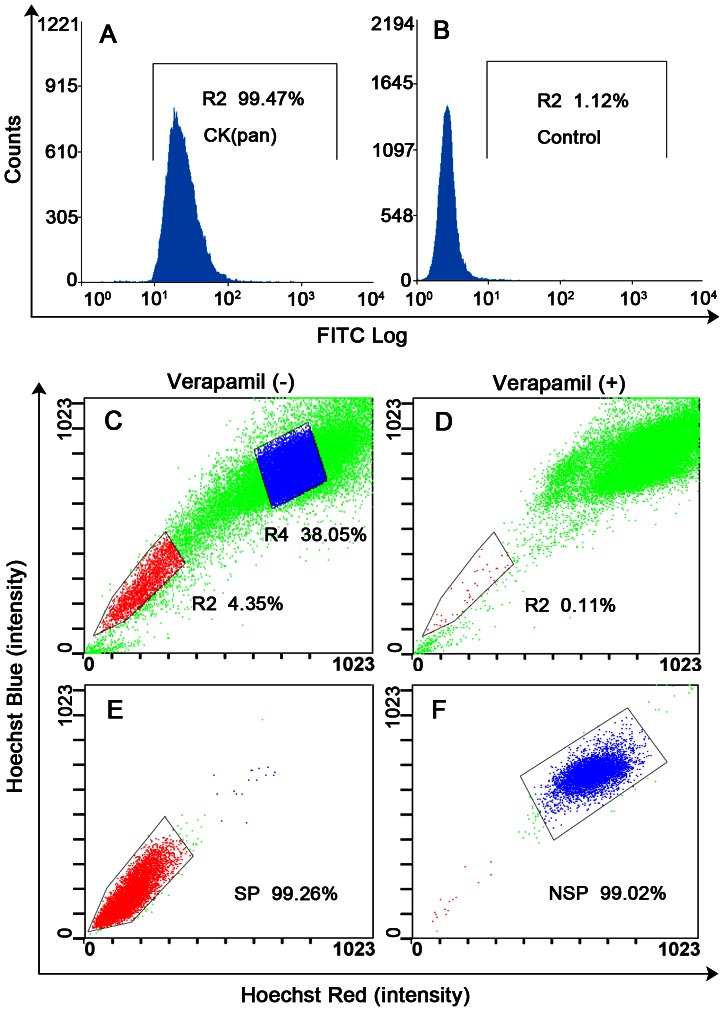
Figure 2. Purity of cultured LSCCs, sorting of SP and NSP cells, and purity of sorted SP and NSP cells.
(A) Purity of cultured LSCCs determined by flow cytometer using cytokeratin (CK) (pan) (98.32±0.93%) and (B) control. (C) Sorting of LSCCs using Hoechst 33342. The R2 gate represents the side population (SP) cells (4.45±1.07% of total cells) and the R4 gate is the non-SP (NSP) cells. (D) The SP proportion after verapamil treatment was 0.14±0.13%. The purity of the freshly sorted SP (99.25±0.23%) (E) and NSP cells (98.98±0.22%) (F).

