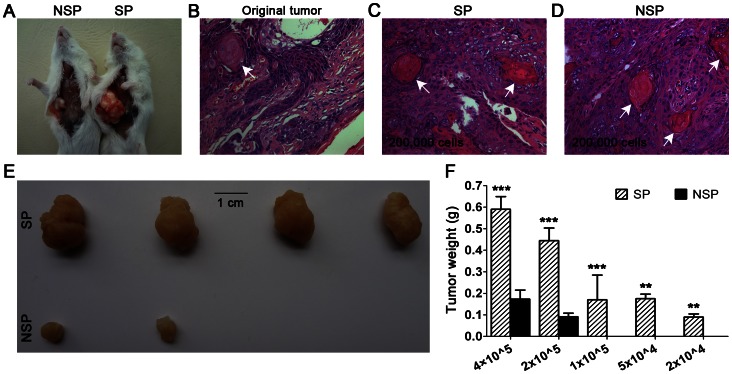
Figure 6. Tumor formation in NOD/SCID mice, hematoxylin and eosin staining, and statistical analysis.
(A) Injection sites of nonobese diabetic (NOD)/severe combined immunodeficiency (SCID) mice. Hematoxylin and eosin staining of tumors deriving from the patient (B), mice (C, tumor formed by side population (SP); D, tumor formed by non-SP (NSP) cells). Both the original and xenografted tumors were typical, well-differentiated, squamous cell carcinoma with keratin pearls observed frequently (arrows). (E) With 2×10⁵ cells injected, SP cells formed four larger tumors (4/4), whereas NSP cells formed two much smaller tumors (2/4). (F) Statistical analysis of SP and NSP tumor weights at different injected cell quantities (***P<0.01, **P<0.05).

