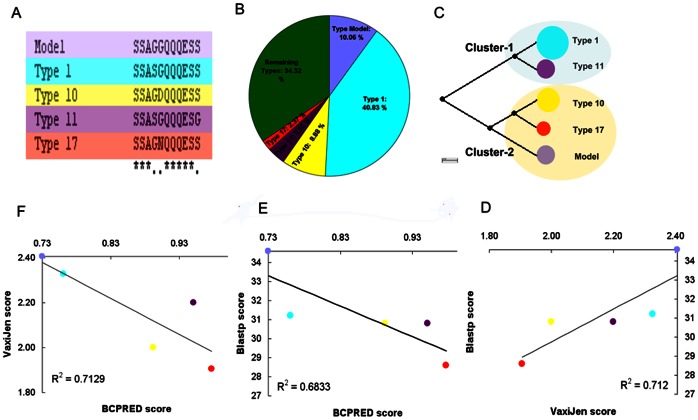
Figure 7. B-cell epitope analysis in A. marginale MSP1a tandem repeats.
The B-cell epitopes were predicted using BCPRED server. The type 1 B-cell epitope was used as reference (Model) for comparisons. (A) Clustalw alignment and amino acid changes in the 5 more represented MSP1a tandem repeat B cell epitopes. B-cell epitope types model (light violet), 1 (blue), 10 (yellow), 11 (dark violet) and 17 (red) are shown. (B) Percent of tandem repeats containing each type of B cell epitopes. (C) Neighbor joining phylogenetic tree based on B cell epitope amino acid sequences showing the two clusters formed by the 5 more represented B cell epitopes. Cluster-1: Types 1 and 11 and Cluster-2: Types Model, 10 and 17. Correlations between VaxiJen/Blastp (D), BCPRED/Blastp scores (E) and VaxiJen/BCPRED (F) scores are shown. These correlations suggest that the epitopes with higher homology (Blastp score) share in common the immunogenic properties represented by VaxiJen/BCPRED.

