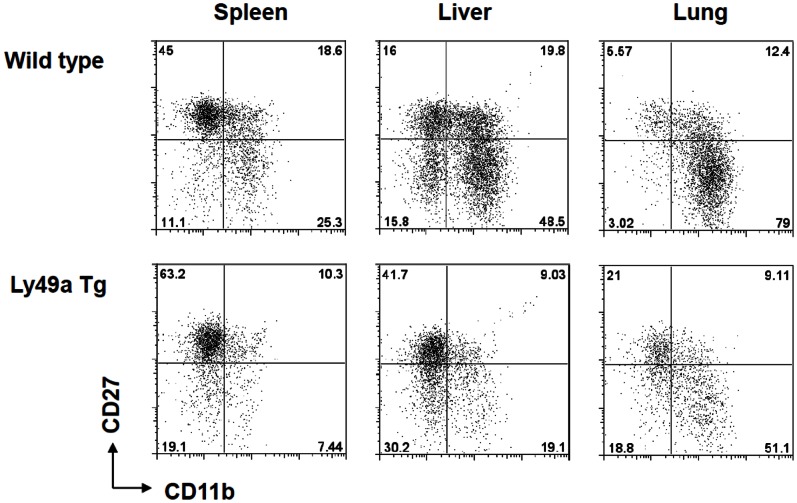
Figure 5. Organ-specific NK cell subset distribution in WT and Ly49A transgenic mice.
Mononuclear cells were isolated from the spleens, livers and lungs of wild-type (upper row) and Ly49A transgenic mice (lower row) and analyzed by flow cytometry. Software gates were set to identify NK cells (NK1.1+ CD3–), which were then examined for the expression of the maturation markers CD27 and CD11b.

