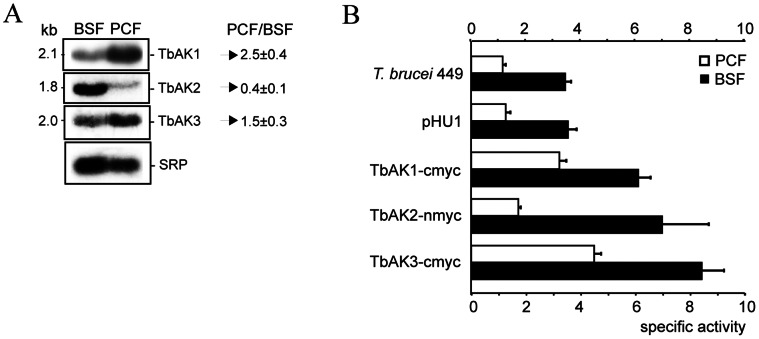
Figure 4. Differential expression of TbAK1-3 in T. brucei.
(A) Northern blot analysis of total RNA (10 µg per lane) isolated from BSF and PCF T. brucei 449. The 3′UTRs of TbAK1-3 were used as DNA probes to detect the respective mRNA transcripts, while the signal recognition particle (SRP) was used as a loading control [32]. Numbers represent the relative mRNA ratios (PCF/BSF) calculated from pixel intensities of the different mRNA bands (ImageJ: http://rsb.info.nih.gov/ij/) after normalisation against SRP, and represent the mean from 3 independent experiments. (B) Specific activities of arginine kinase in total cell lysates from the parental (no expression vector), control (containing pHU1 without insert), and myc-tagged TbAK1-3 expressing PCF (white bars) and BSF (black bars) T. brucei cell lines. Specific activity (µmol phosphoarginine formed per mg protein per min) was determined in the forward (phosphoarginine synthesis) direction using 2 mM arginine and 0.8 mM ATP as substrates, and using 10 µg of protein (total cell-lysate) per assay. Values are the means of at least three independent experiments.

