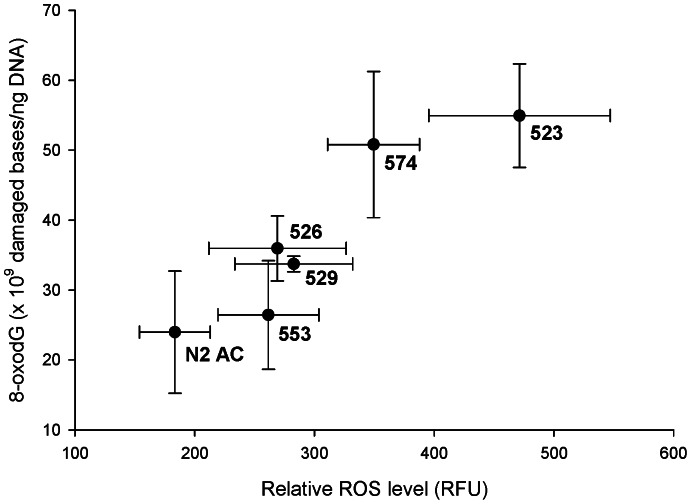
Figure 1. Bivariate relationship of line means for net in vivo ROS level and 8-oxodG content.
Relative reactive oxygen species (ROS) levels are reported in relative fluorescence units (RFU); quantity of 8-oxo-7,8-dihydro-2′-deoxyguanosine, or 8-oxodG, are reported as ×109 damaged bases per nanogram of DNA. Line means of the two metrics were significantly correlated (Spearman’s ρ = 0.943, p = 0.017 with all lines present). Bars represent one standard error. “N2 AC” is the N2 ancestor (progenitor of MA lines, Generation 0); remaining data labels are the Baer MA line numbers.

