
Figure 1.
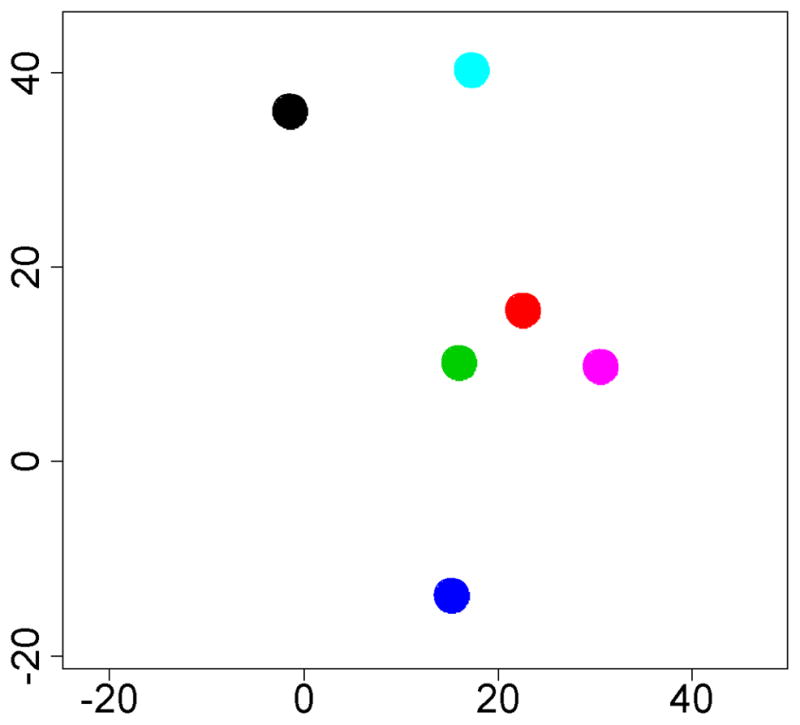
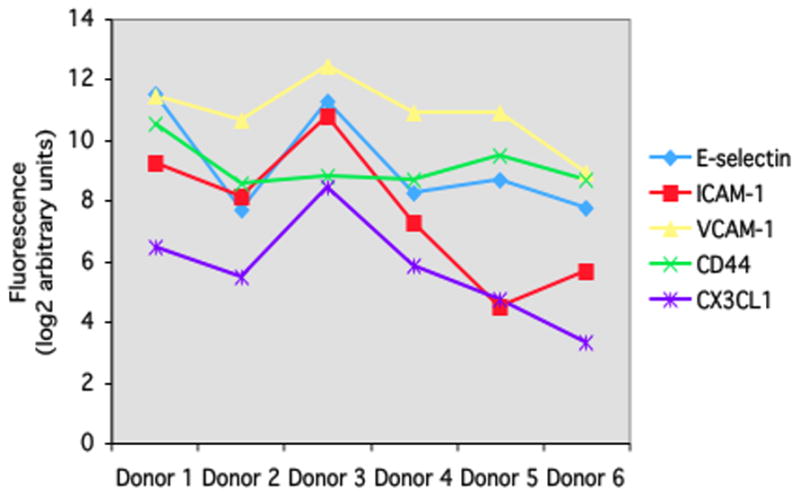
(A) Multi-dimensional scaling plot shows global gene expression by retinal endothelial cells from 6 human donors. Circles designate individual donors. (B) Relative gene expression of selected adhesion molecules in retinal endothelial cells from the same human donors. Normalized fluorescence intensity, which reflects hybridization to the relevant array probes, was averaged for each donor and expressed in log2 scale. Generated using previously published data (Smith et al., 2007).