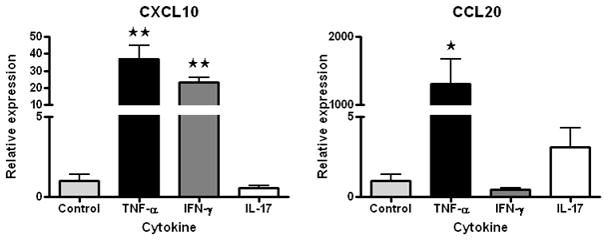
Figure 5.

Graphs showing relative expression of CXCL10 and CCL20 transcript by immortalized human retinal endothelial cells following exposure to one of the following conditions: medium alone; TNF-α (10ng/ml); IFN-γ (20ng/ml); and IL-17 (100ng/ml). Experimental conditions and real-time quantitative RT-PCR are described in the Figure 4 legend. Primer sequences appear in Table 2. In both graphs, bars represent mean and error bars represent standard error of mean (n = 3 wells; * = p<0.05, ** = p<0.01, two-tailed Student’s t-test).
