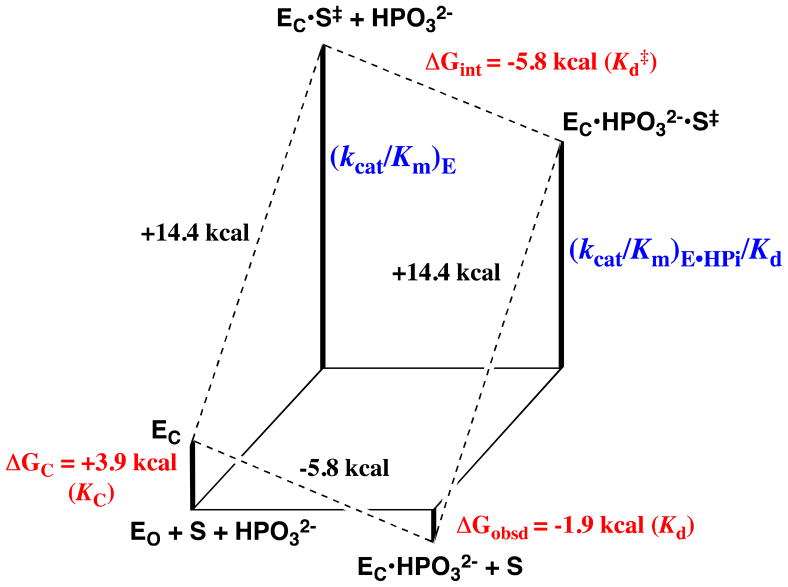
Figure 4.
Free energy diagram for the turnover of the truncated substrate glycolaldehyde (S) by free TIM (EO) and by TIM that is saturated with phosphite dianion (EC•HPO32−, Scheme 11) constructed using data from Ref. 87. The observed tighter binding of phosphite dianion to the transition state complex EC•S‡ to give EC•HPO32−•S‡ (ΔGint = −5.8 kcal/mol, eq 3) than to the free enzyme EO to give EC•HPO32− (ΔGobsd = −1.9 kcal/mol) represents the “interaction energy” of 3.9 kcal/mol.90 This can be attributed to ΔGC = +3.9 kcal/mol for the unfavorable conformational change that converts the inactive open ground state enzyme EO to the active closed enzyme EC (eq 4). The observed value of ΔG‡ = +18.3 kcal/mol for turnover of glycolaldehyde with second order rate constant (kcat/Km)E can be partitioned into ΔG‡ = +14.4 kcal/mol for proton transfer from glycolaldehyde to EC and ΔGC = +3.9 kcal/mol for the unfavorable conformational change that converts EO to EC.

