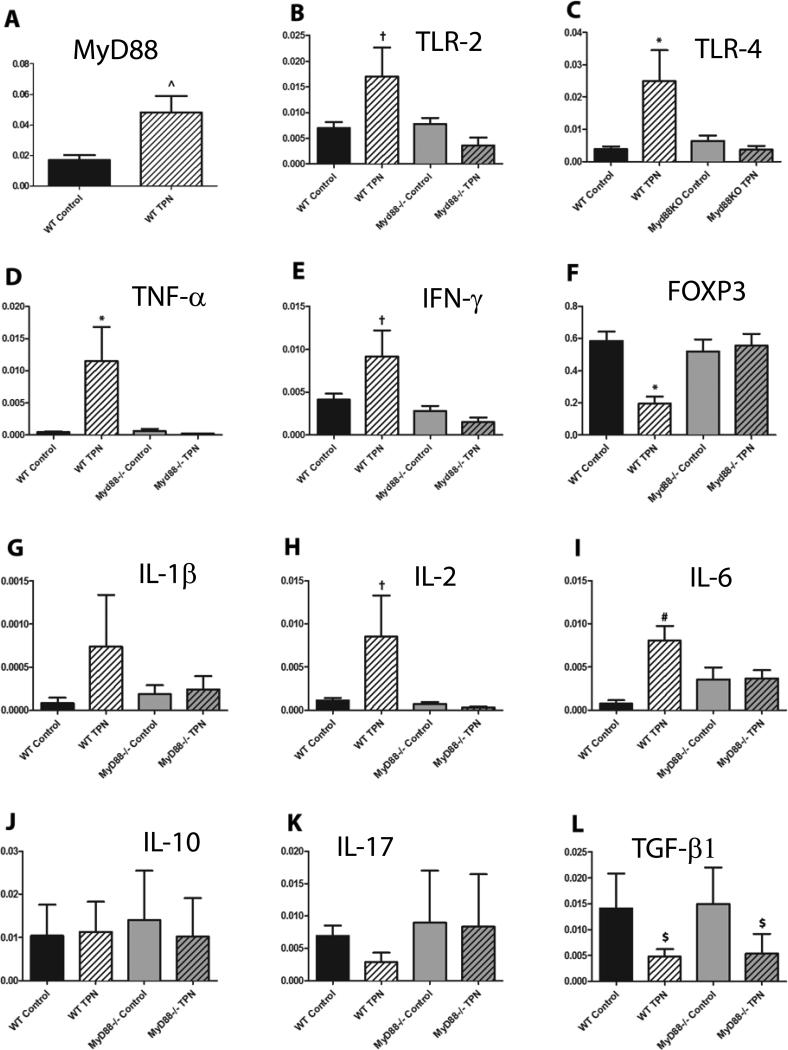
Figure 3.
Quantitative real time PCR on LP cell mRNA (A. MyD88, B. TLR-2, C. TLR-4, D. TNF-α, E. IFN-γ, F. FOXP3, G. IL-1β, H. IL-2, I. IL-6, J. IL-10, K. IL-17, L. TGF-β1) normalized to β-actin except for panel F where FOXP3 mRNA was normalized to the stable portion of the α-chain of the T-cell receptor to account for the fewer number of LP T-cells in the TPN mice (data not shown). ^P<0.05, †P<0.05 compared to MyD88-/- TPN, *P<0.05 compared to all other samples, #P<0.05 compared to WT control, $P<0.05 compared to both control samples. N=6 for WT mice, n=5 for MyD88-/- mice.

