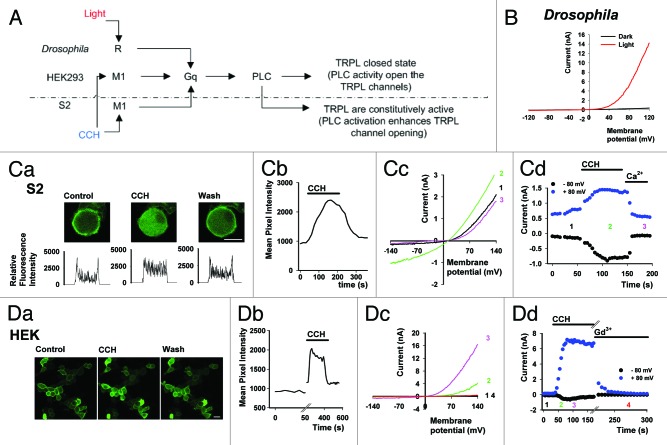
Figure 1. GPCR mediated PLC activation of TRPL in Drosophila photoreceptor, S2 and HEK cells. (A) Scheme of GPCR dependent PLC activation and facilitation of TRPL channels in Drosophila photoreceptors, HEK and S2 cells. (B)Whole cell patch clamp recordings from Drosophila photoreceptors of the trpP343 mutant (expressing only the TRPL channels). I-V curves obtained using voltage ramps at total darkness (black), and during intense light (red). (C, part a) A representative series of confocal images of S2 cells co-expressing eGFP-tagged PH domain, TRPL channels, and M1 receptor. Application of carbachol (CCH, 100 µM) to the bathing solution resulted in the movement of the eGFP-tagged PH domain to the cell body, indicating the activation of PLC and hydrolysis of PI(4,5)P2. Note that washout of CCH from the bathing solution results in reversible marking of the plasma membrane with eGFP-tagged PH domain (scale 10 μm). Bottom: Cross section, line profiles of the fluorescence intensity are given below. (C, part b) A time course of the fluorescence change measured in the cytosol following CCH application (n = 10). (C, part c) Selected I-V curves before CCH (black), after CCH (green) and after addition of extracellular solution with 1.5 mM Ca2+ (magenta) which blocks the TRPL channels by an open channels block mechanism.5 (C, part d) Corresponding currents at +80 and -80 mV. Numbers depict the selected I-V curves (n = 5). (D, part a) A representative series of confocal images from HEK cells co-expressing eGFP-tagged PH domain, TRPL channels, and M1 receptor. Application of CCH (100 µM) to the bathing solution induced movement of the eGFP-tagged PH domain to the cell body in a calcium dependent manner, indicating the activation of PLC and hydrolysis of PI(4,5)P2. Subsequent wash of CCH from the bathing solution resulted in reversible marking of the plasma membrane with eGFP-tagged PH domain (scale 20 μm). (D, part b) A time course of the fluorescence change measured in the cytosol following CCH application from a single cell in the field of view (n = 5). (D, part c) Selected I-V curves before CCH application (black), after CCH (green, magenta) and after addition of extracellular solution with 1mM Gd3+ (red) which blocks the TRPL channels.8 (D, part d) Corresponding currents at +80 and -80 mV. Numbers depict the selected I-V curves (n = 9). No effect was observed when CCH was applied to S2 and HEK cells expressing TRPL channels without the M1 receptor.

An official website of the United States government
Here's how you know
Official websites use .gov
A
.gov website belongs to an official
government organization in the United States.
Secure .gov websites use HTTPS
A lock (
) or https:// means you've safely
connected to the .gov website. Share sensitive
information only on official, secure websites.
