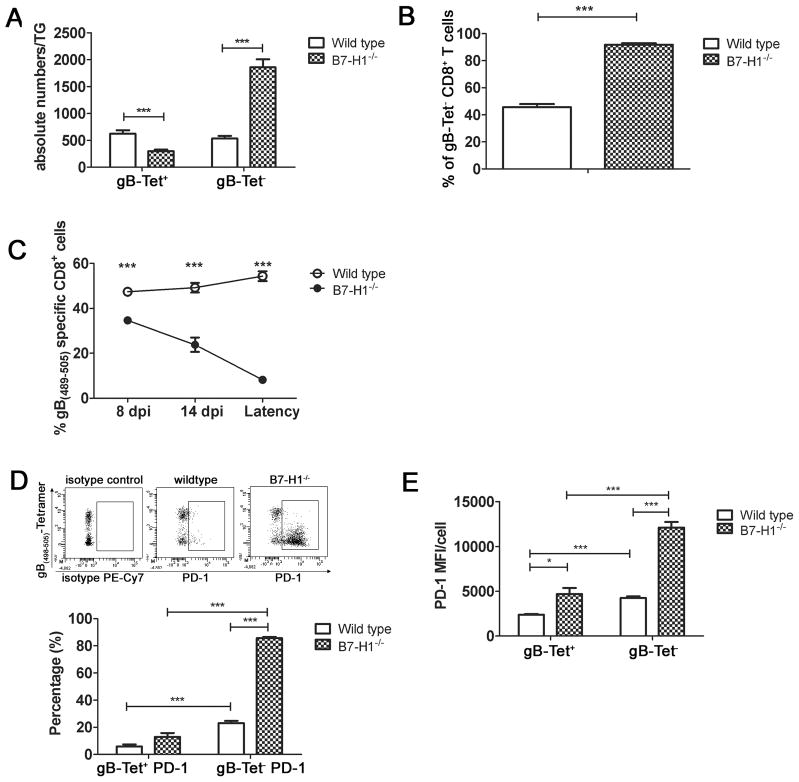
Figure 5. Significantly increased number of PD-1hi gB-Tet− CD8+ T cells in B7-H1−/− TG.
TG from wild type or B7- H1−/− C57BL/6 mice were obtained at 30 dpi (A, B, D, E) or at indicated times after infection (C), and dispersed cells were stained for CD45, CD8, gB(498–505)-tetramer (gB-Tet), and PD-1, and analyzed by flow cytometry. A, bars represent the mean ± SEM number of gB-Tet+ and gB-Tet− CD8+ T cells in TG of WT and B7-H1−/− mice (n = 10 mice). B, Bars represent the mean ± SEM percentage of gB-Tet− CD8+ T cells (n = 10 mice). C, Line graph showing the mean ± SEM percentage of gB-Tet+ CD8+ T cells at indicated time points in TG of WT and B7-H1−/− mice (n = 5 mice). D, Representative dot plots showing PD-1 staining on gB-Tet+ and gB-Tet− CD8+ T cells in TG of Wild type and B7H1−/− mice. Bars indicate the mean ± SEM percentage of PD-1+ gB-Tet+ and gB-Tet− CD8 T cells from WT and B7-H1−/− mice (n= 10 mice). E, Bar graph showing PD-1 MFI for the gB-Tet+ and gB-Tet− CD8+ T cells in wild type and B7-H1−/− TG (n = 10 mice). All data are pooled from three independent experiments. *p ≤0.05, **p ≤ 0.01, and ***p ≤ 0.001

